(Sorry for the cross-post but I just saw that there’s a new “AI Bridge” topic here.)
I have an analytics_event topic setup and things are working almost perfectly. I have two cameras/feeds, and I’m using my IVA to send back messages to the analytics_event topic using a Reference UUID set to the appropriate camera’s ID, and I’m publishing to the appropriate Kafka topic and using a partition key set to the corresponding video stream’s ID.
However, I’m noticing that in the Alarm Manager in the Smart Client, I’m only seeing alerts for one of the cameras, and not the other.
I’m guessing I’m doing something wrong here, but I’m not quite sure what.
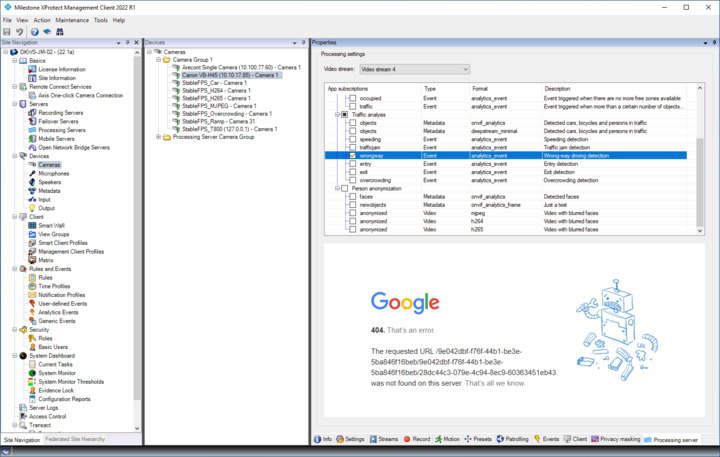
In the Management Client, I notice that neither Camera (Devices->Camera) in their respective “Processing server” tabs have the “analytics_event” subscription. Should the cameras be subscribed to that? It’s curious that neither is subscribed and yet I do see alarms for the one camera.
Any help is, as always, appreciated. Thanks!
When you subscribe to an event topic in the “Processing Server” tab, all it really does is to create an “analytics event” that you can then work with in XProtect (e.g. for creating alarms). So, “subscribe” is maybe not what describes best what is actually going on. XProtect will receive generated events from the AI Bridge no matter whether the event topic is checked or not.
Below I have checked an event topic named “wrongway”. Don’t mind the “google webpage”; this is just because I have associated “https://www.google.com” with the topic.
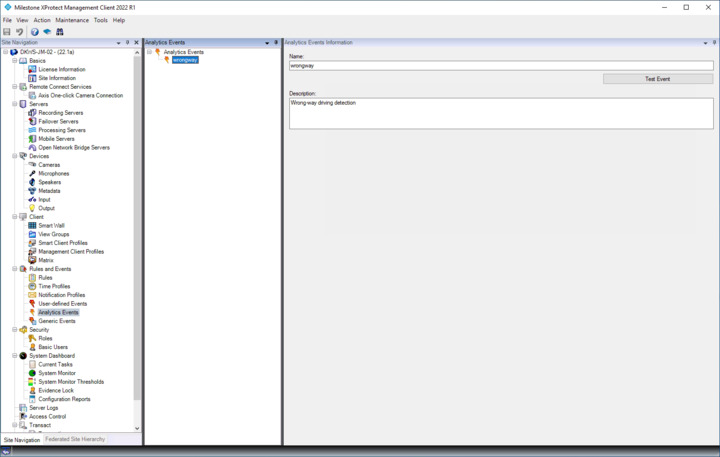
This will create an “analytics event” also named “wrongway”. When an event is received through the event topic, this “analytics event” will be triggered.
Important to note is that you could just as well have created that “analytics event” yourself. Subscribing to an event topic is just a convenience function to make this a bit easier.
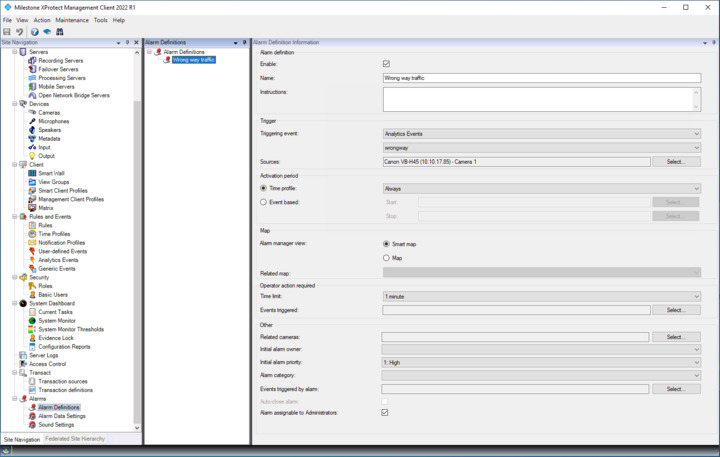
To make the event turn into an alarm and show up in the Alarm Manager in the Smart Client, you have to create an alarm definition.
My guess is that you either is missing an “analytics event” or maybe an “alarm definition”.
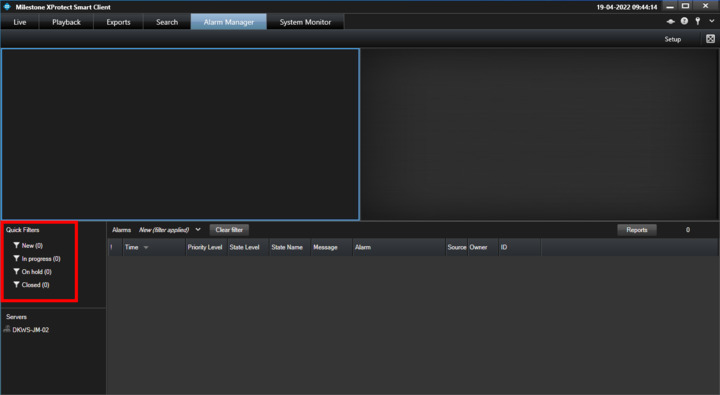
Note that the Alarm Manager in the Smart Client can run in two different modes. One showing “events” and one showing “alarms”. If you have the “states” as highlighed below, then you are showing alarms.
If you click in this area (to give it focus) and the click on the “Setup” button near the top right corner, you can change which mode you are in.
You were right about the alarm definition: I had forgotten that I’d only set it up to monitor one source instead of both sources.
Thank you for your insight and help!