Is there anybody who has experienced increasing system memory while PlaybackUser sample is being executed?

Every time I run PlaybackUser sample, I see the system memory increases and never be released before I kill the process.

The problem is not the sample as it is, but the application that I am developing crushes for this symptom.

I have tried to figure out what is the problem and how to solve this, but there was nobody to give the answer.

Only answer that I gave from Milestone Support Community is “ask to developer forum”.

Please help me with this if there is anyone who has the same experience and know how to solve this problem.

Might it be the leaks reported in this thread?

(Try to use the hot-fixed build.)

https://mymilestone.force.com/developer/s/question/0D50O00003i08D5SAI/

Thank you.

I`ll try to test with the hotfix and give you feedback.

@Bo Andersen

I have tested PlaybackUser sample with the hot fix.

I also installed .Net F/W to 4.7 but I could not see any effect.

Here are the memory consumption of the application for every 5 minutes.

You can see the memory consumption is increasing.

The larger screen size I use, the faster memory consumption goes up.

As soon as I change the mode from live to playback, memory consumption goes down all of sudden like the image below.

How can I fix this problem?

If you use the Smart Client do you experience the leak?

Please try to upgrade your graphics drivers.

If that does not solve it:

Questions-

Is this a real physical computer with graphics or is this some sort of virtual machine?

Version and bitness of client (Smart Client or MIP SDK)?

(example MIP SDK 2017R3)

Operating System version and bitness ?

(example: Windows 10 64bit)

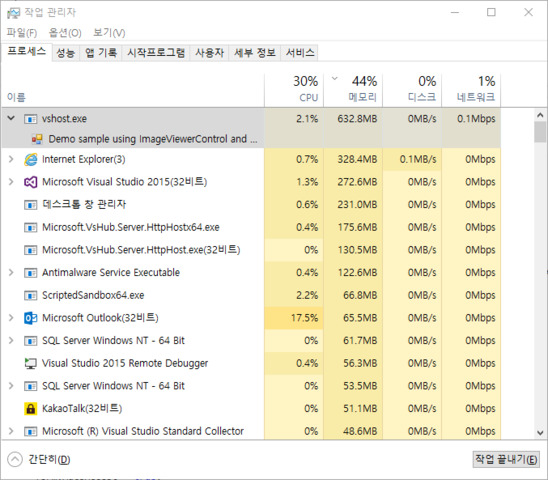
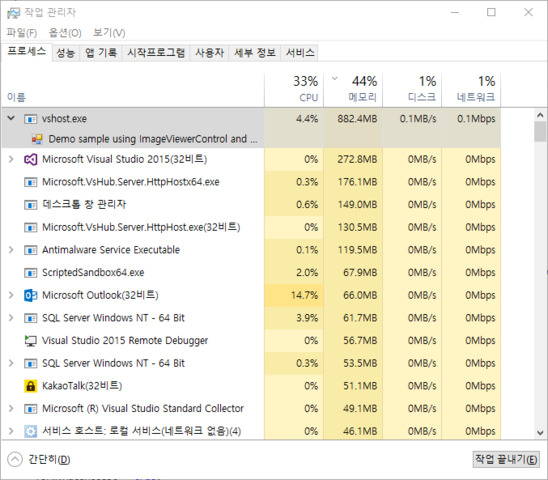
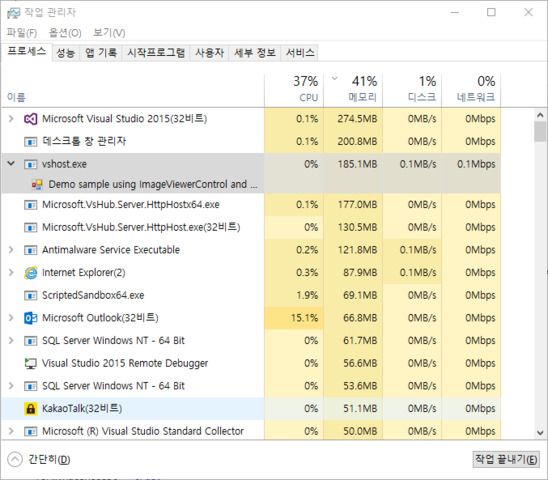
CPU model and usage ?

(example: Intel i7 4770K , 70% load)

RAM quantity and if dual channel is setup ?

(example: 16 GB 2 slots 8GB each)

Intel Gfx model and driver version ?

(example: HD 4600, Driver version: 10.18.14.4264, Driver date: 04-08-2015)

Dedicated Gfx model and driver version ?

(example: Nvidia GTX 750, Driver version: 10.18.13.5582, Driver date: 25-08-2015)

Length of the GOP and fps ( pr camera) ?

(example: default (or custom 100), 8 fps (or 10 fps))

Video codec and resolution ?

(example: H264 800x600 and H265 1920x1080)

Video buffering setup for the devices ?

(example: default (or 500ms…))

Diagnostic overlay HW acceleration indicator ?

(example: shows ON)

Please attach DxDiag log file (run DirectX Diagnostics (dxdiag.exe) and save a log file to send to us).

Together with the DxDiag log file please also send a screen capture showing the diagnostics overlay info.

I am curious: Have you been testing multiple client workstations? If you have; do they all have the issue?

The PC that I first noticed this is happening is an industrial PC(

model code : SYS-7W7130-4A01, Adventech).

I installed one application program that I`m developing on the PC and I found the app crushes around 20 minute after I activate the function which is related to ImageViewerControl.

So, I decided to test the sample code that I`ve refer to integrate MIP to my application, the result is the same(the memory increases constantly).

I`ve never tested the sample to run on the other pc but my dell laptop, but I confirmed the sample symptom is happening on two different PCs.

I do not use virtual machine, all are real machines.

Smart Client has not caused this problem so far, this happens only when I use MIP SDK.

Here is the spec of my PC.

OS : Win 10 Enterprise 64bit.

Processor : Intel Core i7-6820HQ 2.70GHz

Memory : 16 GB

Graphic :

  • NVIDIA Quadro M3000M
  • CUDA Core : 1024
  • Graphic Clock : 823MHz
  • Direct3D API Ver : 12
  • Driver Ver : 354.45

When I open my device manager of system I can see two display adapter listed like below.

  • Intel HD Graphic 530 (driver ver. 20.19.15.4483)
  • NVIDIA Quadro M3000M (driver ver. 10.18.13.5445)

Codec that I`m using is H264, 1024x768 resolution.

I attach DxDiag for both the client and the server.

Please check and tell me what is wrong with me.

We have seen these issues when the drivers are not up to date, and your driver on the client machine is outdated.

I checked here for his CPU the latest is:

https://downloadcenter.intel.com/product/88345/Intel-HD-Graphics-530

23.20.16.4901

And you say that your intel driver is

20.19.15.4483

So maybe you can try this first and then we can continue troubleshooting. Your Nvidia may also be outdated, I don’t know how to find the corresponding nvidia driver install version vs the version in dxdiag but you should be able to check it in the nvidia control panel and see if you need to update.

Frankly, I was skeptical about that updating drivers can solve this problem but I solved the problem!!!

Thank you for your support.

I will test another PC with the same way I`ve done to the PC that is fixed already.