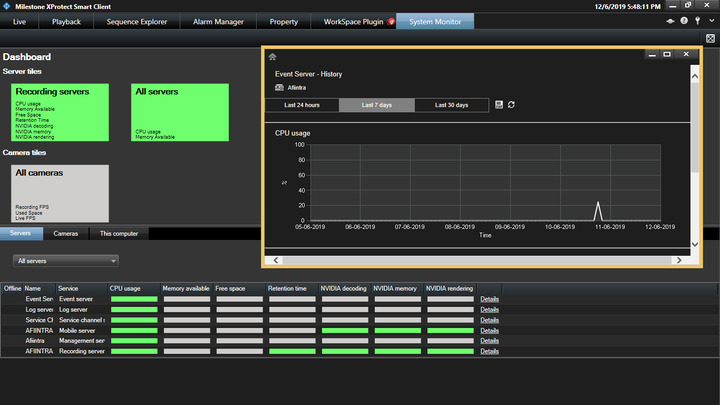
So I’m tasked with developing a plugin that has a better interface than the built-in system monitor. At the very least, I want a plugin that display a multi-line graphs for each CPU usage.
Any help for this would be greatly appreciated.
So I’m tasked with developing a plugin that has a better interface than the built-in system monitor. At the very least, I want a plugin that display a multi-line graphs for each CPU usage.
Any help for this would be greatly appreciated.
I could be wrong, but I don’t think the System Monitor component is extensible via MIP SDK and I suspect the individual logical CPU utilization performance counters are not tracked today.
You may need to look into either making your own purpose-built monitoring software and Smart Client plugin, or probably a bit easier - consider building a MIP Plugin to display a dashboard with data from PRTG/Nagios/other widely used monitoring software.
Most of what you see in System Monitor is available as a Performance Counter on the various servers, including camera frame rates, and most monitoring applications like PRTG are able to watch whatever counters you specify.
How do I access the Performance Counters from my external software or MIP plugin?
Also, does PRTG/Nagios work on test servers (which is all inside one computer)
I have limited experience using various monitoring applications but I’m fairly certain you can run it and monitor the same machine it’s installed on.
As for the performance counters, this is a native feature of Windows. If you click Start > type ‘perfmon’ and open Windows Performance Monitor, you can click the plus sign and add a counter to the live performance graph there. Milestone registers various counters under VideoOS* so look towards the bottom of the list of various categories and you’ll find some Milestone-specific counters you can explore.
There’s limited documentation on these as they’re mostly used internally for DataCollector/System Monitor, but they can be used just like any other counter such as CPU time, % Idle Time on disks, or memory utilization. Just about any monitoring/watchdog style application will give you access to these on the local machine or remote machines.