Siemens.Gms.ApplicationFramework.exe is not known in Milestone and this dump does not give any meaning for Milestone Support. Please see if you can debug this to an extend where you can see the source code (code that uses methods on the MIP SDK library) that causes the crash.
I took a look at the dumpfile and seems that there is a HandleOutOfBandEvent that goes wrong. i cant see how or why it goes wrong. We need a bit more information from you as there is no indication why this handler call would fail.
Can you let us know:
what your application implements (maybe snippet of code or pseudo code)
when does the error occur, is it always/sometimes, at start/shutdown/after a while?
what hardware are you using
what stream codec and resolution is
can you reproduce this with one of our MIP SDK samples?
The crash occur almost always on that machine, while on others less frequently. It happens during normal operation, not during startup o shutdown phases.
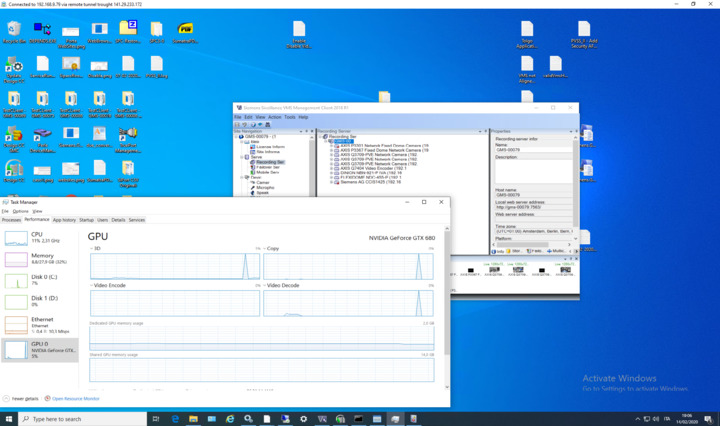
I can see from the data you have provided that you dont have any hardware acceleration on the machine you are testing on:
CPU Xeon 6134 - no Intel Quick Sync
GPU GTX 680 - generation Fermi, too old, we support from Keplar
We will need to be able to reproduce this in house so we can debug what happens as it appears there is no real pattern other than the specific machine you are using.
Does this happen on a specific camera?
What codec and resolution is used on the device?
Is this happening on 13.2 version or also on 13.3?
did this start to happen after an upgrade?
When you say that “on others happens less frequently” is there a pattern on other machines.
How is the network setup - are all cameras and machines on the same switch? Is there a pattern on which machines fail and what switch they are on?
.. and forgot to mention, the spike in the GPU cant be coming from us as we dont use it due to the lach of hardware with Hardware Acceleration capabilities.
We’ve updated to 13.3 and can confirm that the issue is also happening there, with basically the same crash dump (CoreToolkits.dll).
The issue is appearing for us when streaming via the VideoOS.Platform.Client.ImageViewerWpfControl is started or stopped. Usually multiple tiles using this control-type are initialized started and stopped simultaneously.
Seems that this happens when we started many live video, then we stopped them and we started another set of stream again. At the moment we’re able to reproduce with DesigoCC client application. Christoph will give you the right MIP SDK calls